Collecting data on the Euro-Peristat indicators
Euro-Peristat has collected data on its perinatal health indicators births at the national level from data providers in each country starting in 2000. Data were first collected every 5 years or so and then yearly starting in 2015. While the core indicators have been collected at all time points, unfortunately the recommended indicators were only collected up until 2010, with a sub-set collected in 2015.
Euro-Peristat defines births to include terminations of pregnancy, spontaneous stillbirths and live births that occur at 22 weeks of gestation or over. If gestational age is missing, births are included if birthweight is 500 grams or more.
Euro-Peristat first started collecting data using excel data tables and changed its procedures to adopt a federated approach to facilitate data collection starting with the year 2015.
Collecting data from 2000 to 2015: using excel tables
Euro-Peristat collected data on births in 2000, 2004, 2010 and 2015 using structured excel worksheets. Based on the core and recommended indicators, one or more excel data collection tables was established for each indicator. For instance, for the stillbirth indicator, which is presented by multiplicity, gestational age and birthweight, the data collection table includes the number of stillbirths by multiplicity and gestational age, as illustrated here, whereas another excel sheet collects this information by birthweight in 500-gram categories. Starting in 2010, these sheets were combined into an excel data collection booklet for the core and recommended indicators.
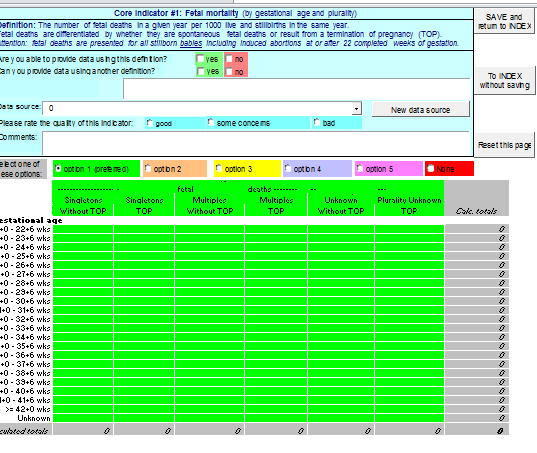
Each data provider had to fill in more than 50 tables to provide data for all the indicators. Providers could use multiple data sources and, in addition to the data tables, each sheet included information about the data source and whether the country was able to provide data in accordance with the Euro-Peristat definition. The 2015 versions of these documents are available for download.
Approach for collecting data from 2015 onward: a federated model approach
During Euro-Peristat’s participation in the European PHIRI project, we developed a federated approach to data collection.
Defining a common data model
In this approach, a common data model (CDM) is specified. The CDM defines the variables, definitions and formats and the eligible population required to produce the Euro-Peristat tables that were collected in the excel workbooks (see below). Thus far, a CDM has been defined and tested for Euro-Peristat’s core indicators (fetal, neonatal and infant mortality, gestational age and birthweight distributions, type of pregnancy (singleton or multiple), maternal age, parity and mode of delivery).
| GA | Gestational age in completed weeks |
| BW | Birthweight |
| SEX | Sex of baby |
| MULT_B | Singleton or multiple pregnancy |
| VITAL | Vital status (live birth, termination of pregnancy, stillbirth) |
| NNM | Neonatal death <28 days |
| NNM_pre | Neonatal death <7 days |
| IM | Infant death <365 days |
| MATAGE_B | Maternal age |
| PARITY_B | Parity |
| PRES | Fetal presentation |
| PREVCS | Previous caesarean delivery |
| MOD | Mode of delivery |
| TYPECESAR | Type of caesarean (prelabor or intrapartum) |
| INSTRUMENT | Instrumental delivery |
| ONSET | Mode of onset of delivery |
Creating common aggregate tables for each country
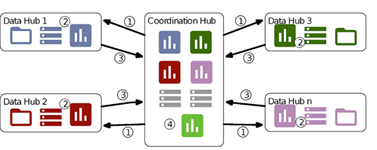
Based on the CDM, the authorised data controller within each data providing institution (called a data hub) creates a data file based on the specifications of the CDM, selecting for the population and time period covered by the data collection exercise. The data controller then runs R scripts on local servers to produce aggregate tables and summary statistic (e.g. variable means or coefficients from statistical models). These results are then transferred to Inserm, which coordinates the Euro-Peristat project (the coordination hub).
The Figure illustrates this process where 1=specifications sent from Inserm to the data providers and 2=the production of the data tables by the data hubs and 3= results of the analyses sent back to Inserm. More information of this process is available here while the data hubs are described here.
Specifications for the common data model and the scripts are stored on the open source depository Zenodo.
Benefits of a federated model
- Individual person-level data (personal data) including outcomes and exposures are not shared, meaning they do not leave data servers in the institution with authorisation to hold and analyse them.
- However, it is possible to format individual data in the same manner, making it easier to ensure that the indicators are comparable. For instance, data are collected on the number of missing observations.
- Once the CDM is set up in each data hub, it is easy to rerun the R scripts to correct data or to produce new tables and the CDM can be updated with data from the most recent year. This makes it possible to collect data more frequently.
Cleaning and analysis
An initial data check is integrated into the R scripts, providing the number of total and missing observations and basic summary results of the main indicators that are collected. The data provider also reviews the aggregate data tables before transferring the outputs to the central hub. The coordination team then performs validation checks, including internal validation by verifying the percentage of missing data and consistency between indicators as well as external verification with data collected previously and other sources, notably Eurostat. Queries are sent to the national teams.
Summary data tables are then sent to the data providers from each country for review. During network meetings, data are presented and compared between countries in order to detect and investigate outliers. This collective work of analysing data on the indicators contributes to ensuring that problems are identified and that the data are appropriately interpreted. For each of the Euro-Peristat publications, data tables and manuscripts are reviewed by the data providers and other experts in each country.